
Biological control is a complex, knowledge‐intensive practice that requires growers and pest management consultants to learn natural enemy and pest life cycles, toxicity and effectiveness of insecticides at different life cycle stages, strategies for managing insecticide resistance, and maintenance of long‐term ecological balance while controlling pests and maximizing production. As part of a large USDA Specialty Crop Research Initiative (SCRI) project, researchers at Washington State University, University of California‐Berkeley, and Oregon State University are seeking to better understand apple, pear, and walnut growers’ experiences and perspectives related to pest management, in general, and biological control, in particular. This report presents results from a 2011 survey of Oregon and Washington pear growers. Survey results will inform future educational and outreach efforts.
Download PDFs: OR-WA combined report (104KB) OR summary (153KB) WA summary (153KB)
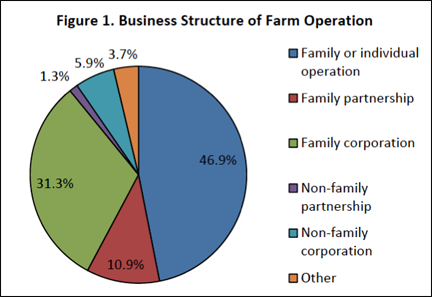
The majority of survey respondents (89%) were orchard owners, partners, or lessees, while 9% were hired managers. Approximately 47% of respondents described their farm operations as family or individual operations (see Figure 1).
Respondents operated, on average, 140 acres of farm/ranch land in 2010. Nearly three quarters (72%) of respondents produced other agricultural products (e.g., apples, cherries) in addition to pears.
Respondents grew, on average, 46 acres of pears in 2010. The most popular pear varieties (in terms of mean acres) were Green Anjou (17 acres), Bartlett (13 acres), and Comice (6 acres).
Eleven percent of respondents reported some certified organic pear acres (ranging from 1 to 140 acres with a mean of 24 acres).
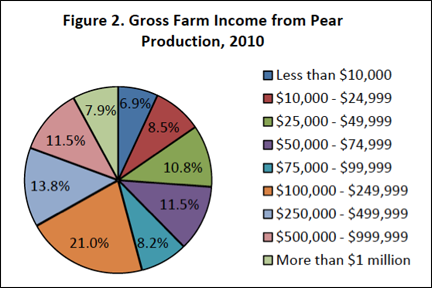
Twenty six percent of respondents had less than $50,000 in gross income from pear production, while 19% reported $500,000 or more in gross pear income (see Figure 2).
When making pest management decisions for their pear orchards, survey respondents consider economic cost, environmental impacts, and human health impacts, among other factors. Approximately 67% of respondents believe economic cost is “very important” in pest management decision‐making, 65% believe human health impacts are “very important,” and 55% believe environmental impacts are “very important” (see Table 1).
| Not Important (%) | Somewhat Important (%) | Very Important (%) | |
|---|---|---|---|
| Economic Cost | 6.1 | 27.1 | 66.8 |
| Human Health Impacts | 3.7 | 31.4 | 64.9 |
| Environmental Impacts | 4.0 | 41.5 | 54.5 |
The most important sources of information for making pest management decisions for pear orchards were agricultural chemical distributor fieldmen; insecticide label information; packing warehouse fieldmen; formal education and continuing education classes; and industry sponsored conferences, workshops, and seminars. The least important sources of information for making pest management decisions were private pest management consultants, in‐house pest management consultants, marketing organizations, commodity associations, and immediate neighbors.
Survey respondents reported varying levels of contact with Oregon State University (OSU) and/or Washington State University (WSU) with regard to their pear orchards. The most frequent forms of contact were using OSU/WSU pest management guides, reading OSU/WSU bulletins, and visiting OSU/WSU websites. On‐farm visits by OSU/WSU employees, research collaborations with OSU/WSU scientists, and visits to OSU/WSU offices were less common (see Table 2).
| Not At All (%) | Once (%) | Twice (%) | Three Times or More (%) | |
|---|---|---|---|---|
| Used pest management guide | 33.8 | 7.9 | 8.2 | 50.2 |
| Read bulletin of report | 23.8 | 7.6 | 21.6 | 47.0 |
| Visited website | 40.3 | 8.9 | 9.3 | 41.5 |
| Attended meeting, workshop or field day | 38.3 | 19.6 | 20.6 | 21.5 |
| Visited office | 73.0 | 12.6 | 6.9 | 7.5 |
| Research collaboration | 85.8 | 5.4 | 4.4 | 4.4 |
| On-farm visit | 85.8 | 5.0 | 4.7 | 4.4 |
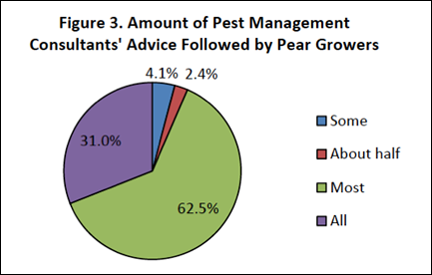
Most survey respondents (90%) used the services of one or more pest management consultants. Of those respondents, 10% consulted with pest management consultants more than once a week, 50% once a week, 34% every 2 to 3 weeks, and 6% once a month or less. Most respondents (94%) followed either most or all of the advice provided by pest management consultants (see Figure 3).
Approximately 85% of respondents reported using computers for their farm business, while 25% use smartphones. Nearly 75% of respondents regularly access the Internet for farm information. Respondents were asked about their preferred methods for receiving information on pest management in pears within the next three years. The following methods of information dissemination were most preferred: printed materials, Internet, E‐mail, in‐person meetings (large group), and field days. The least preferred methods were social media, online meetings or workshops, online courses, and in‐person courses.
Respondents were asked about changes in their use of selected pest management practices during 2008–2010 (see Table 3). Nearly 48% of respondents decreased their use of insecticides more harmful to non‐target species. Over 45% of respondents increased their use of insecticides less harmful to non‐target species; 29% increased their use of monitoring for insect pests; 23% increased their use of pheromone or sticky trips; 19% increased their use of monitoring for natural enemies; 17% increased their use of degree day calculations; and 15% increased their use of biological control practices.
| Decreased (%) | Same (%) | Increased (%) | Did Not Use (%) | Don't Know (%) | |
|---|---|---|---|---|---|
| Insecticides less harmful to non-target species | 4.7 | 39.3 | 45.8 | 1.2 | 9.0 |
| Monitoring from insect pests | 0.9 | 67.6 | 29.0 | 0.3 | 2.2 |
| Pheromone or sticky traps | 1.9 | 56.1 | 23.2 | 16.2 | 2..5 |
| Monitoring for natural enemies | 0.9 | 66.9 | 18.8 | 8.1 | 5.3 |
| Pheromone mating disruption | 3.8 | 44.4 | 18.1 | 31.3 | 2..5 |
| Degree day calculations | 0.9 | 65.5 | 17.4 | 10.1 | 6.0 |
| Biological control practices | 0.3 | 52.7 | 14.6 | 26.0 | 6.3 |
| Insecticides more harmful to non-target species | 47.8 | 34.6 | 1.9 | 6.6 | 9.1 |
Survey respondents were asked about their experiences with two primary pear pests: codling moth and pear psylla. These pests exerted varying degrees of pressure in 2010 (see Table 4).
| No Pressure (%) | Low Pressure (%) | Medium Pressure (%) | High Pressure (%) | Don't Know (%) | |
|---|---|---|---|---|---|
| Codling moth | 11.0 | 53.5 | 27.4 | 4.4 | 3.8 |
| Pear psylla | 4.9 | 31.3 | 48.5 | 12.6 | 2.8 |
Respondents were asked to indicate the degree to which they select insecticides and time insecticide applications (for control of primary pear pests) so they are least disruptive to the natural enemies of secondary pests. They were also asked to indicate the degree to which they use spot or border sprays to minimize harm to the natural enemies of secondary pests. Results are reported in Table 5.
| Never (%) | Sometimes (%) | Always (%) | Don't Know (%) | |
|---|---|---|---|---|
| Codling Moth | ||||
Select insecticides so they are least disruptive to NEs * |
1.6 | 45.3 | 41.5 | 11.6 |
Time insecticide applications so they are least disruptive to NEs |
8.3 | 43.2 | 29.7 | 15.9 |
Use spot sprays to minimize harm to NEs |
47.6 | 38.0 | 9.6 | 4.8 |
| Pear Psylla | ||||
Select insecticides so they are least disruptive to NEs * |
6.4 | 48.6 | 35.6 | 9.4 |
Time insecticide applications so they are least disruptive to NEs |
11.6 | 45.9 | 29.4 | 13.1 |
Use spot sprays to minimize harm to NEs |
62.3 | 25.5 | 7.0 | 5.2 |
| * NEs = natural enemies of secondary pests | ||||
Respondents were asked about their use of degree‐day calculations to predict codling moth generations, monitor infestation levels, and properly time sprays for different generations. Nearly 60% of respondents reported always using degree‐day calculations, while 26% reported occasional use and 6% reported no use of degree‐day calculations. Eight percent of respondents did not know if degree‐day calculations were used in their pear orchards.
Approximately half (52%) of respondents used pheromone mating disruption to control codling moth in their pear orchards in 2010. Of those respondents, 92% used hand‐applied dispensers (e.g., Isomate C Plus) and 18% used aerosol puffers (e.g., Puffer CM‐O).
Survey respondents were asked about their use of selected insecticides to control codling moth and pear psylla in 2010. The most popular insecticides for codling moth were Delegate (63% of respondents), Assail (48%), Altacor (40%), Guthion (22%), Rimon (22%), Intrepid (15%), and Success (14%). The most popular insecticides for pear psylla were horticultural spray oil (76% of respondents), Delegate (60%), sulfur (55%), Abamectin (e.g., Agri‐Mek) (52%), Ultor (46%), Esteem (45%), Assail (44%), Surround (40%), and Actara (35%).
Survey respondents were asked if certain secondary pear pests required treatment in their pear orchards in 2010. The following pests required treatment by the reported percentages of respondents: rust mite (58%), spider mite (38%), San Jose scale (36%), leafroller (33%), grape mealybug (23%), European red mite (23%), green aphid (9%), pear thrips (6%), and pear leaf blister mite (3%). Sixteen percent of respondents reported that no secondary pests required treatment; 11% did not know if secondary pests required treatment.
Respondents were also asked about changes in secondary pest problems in their pear orchards during 2008–2010. Most respondents did not face increased secondary pest problems (see Table 6).
| Decreased (%) | Same (%) | Increased (%) | Not a Problem (%) | Don't Know (%) | |
|---|---|---|---|---|---|
| Rust mite | 11.7 | 48.4 | 8.9 | 21.5 | 9.5 |
| San Jose scale | 14.2 | 29.5 | 6.3 | 37.4 | 12.6 |
| Grape mealybug | 12.2 | 23.7 | 6.3 | 43.1 | 14.8 |
| Green aphid | 8.4 | 19.2 | 5.7 | 50.5 | 16.2 |
| Spider mite | 10.5 | 42.1 | 5.6 | 28.6 | 13.2 |
| European red mite | 9.2 | 35.3 | 3.6 | 37.0 | 14.9 |
| Leafroller | 16.1 | 32.2 | 2.7 | 35.6 | 13.4 |
| Pear thrips | 7.4 | 20.5 | 2.3 | 49.7 | 20.1 |
| Pear leaf blister mite | 4.5 | 16.3 | 1.7 | 56.4 | 21.1 |
| Pear leaf curling midge | 5.5 | 14.2 | 0.0 | 59.9 | 20.4 |
Three quarters (76%) of survey respondents relied on one or more biological control practices to control for insect pests in their pear orchards in 2010. Of those respondents, 95% minimized factors that harm natural enemies, 24% enhanced natural enemy habitats, and 6% released commercially produced natural enemies. Respondents, on average, had been using “conservation biological control” (i.e., minimizing factors that harm natural enemies and enhancing natural enemy habitats) for 10–11 years and “augmentative biological control” (i.e., releasing commercially produced natural enemies) for 5 years. The commercially produced natural enemies released included ladybugs, lacewings, and wasps to control aphids and psylla.
Survey respondents who relied on biological control practices to control for insect pests in their pear orchards perceived many benefits of biological control. The primary perceived benefits were reduced pesticide use (fewer sprays), reduced input costs, environmental protection, worker health/safety, and increased natural enemies (beneficial insects).
Survey respondents who did not rely on biological control practices to control for insect pests in their pear orchards provided many different reasons for their non‐adoption of biological control. The primary reasons for non‐adoption were perceived ineffectiveness, not recommended by fieldmen, lack of knowledge, and high cost (i.e., not cost effective).
This research is supported by grant #2008-04854 from USDA-NIFA Specialty Crop Research Initiative (SCRI) program. Matching funds were also provided by Washington State University, Oregon State University, University of California-Berkeley and the Washington State Tree Fruit Research Commission.

USDA-NIFRA SCRI grant #2008-04854