
The annual reports are broken up into sections. Click on the tab heading to view the report section submited by the respective section investigation leader.
We have two major goals for this project. The first is to improve the long-term sustainability of the apple, pear and walnut industries in the western US by enhancing biological control of pest insects and mites. The second goal is to synthesize the information developed in this project along with existing information to provide the outreach tools needed to bring about change in grower practices.
Our advisory group has three outside scientists, one extension agent from each state, and two industry stakeholders from each state.
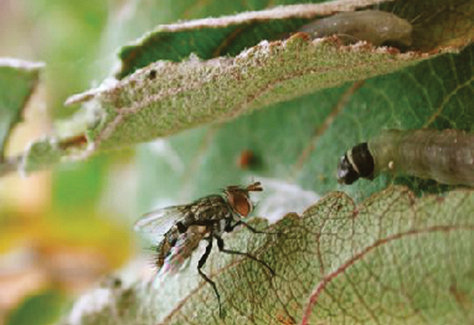
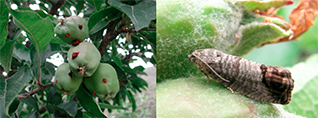
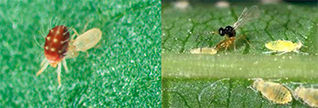
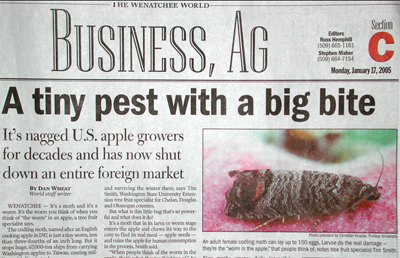
If not controlled, codling moth (CM) can devastate apple, pear, or walnut crops in the western US (right top row). Because of its damage potential, CM is considered the key pest around which management is focused. With the advent of mating disruption, the intensity of the chemical program has been reduced, allowing fewer sprays and increasing the chance of biological control (BC) of our secondary pests. The Federal Food Quality Protection Act of 1996, has also resulted in elimination or restriction of organophosphate materials (particularly Guthion or azinphosmethyl in 2012), and indirectly stimulated the registration of a range of new insecticidal chemistries. While these new chemicals have lower mammalian toxicity profiles, their impacts on natural enemies has not been well studied and the change to the new codling moth controls has resulted in outbreaks of secondary pests that were previously controlled by natural enemies.
Natural enemies can be broadly classed as parasitoids or predators. Parasitoids are intimately associated with a given stage of the pest, making them relatively easy to sample and collect. However, predators are free-living and may or may not be found in tight association with any specific pest; they often feed on a broad range of prey and they may consume part or all of their prey leaving no sign of their activity. Our project is specifically aimed at quantifying the importance of predators as well as conserving all natural enemies by using least disruptive chemicals applied at times when they will have minimum effect on the natural enemy complex.
Traditional bioassays treat a pest or natural enemy with a pesticide topically or via residue, then measure acute mortality at some fixed time limit. Our assays are done in two stages (1) “traditional” and (2) “demographic”. The demographic assays incorporate multiple modes of pesticide uptake, then looks at the sub-lethal effects (reduced fecundity, altered sex ratios, etc.) and uses demographic models to measure change in population growth rates. This gives us a standard by which to compare different pesticides across natural enemy species.
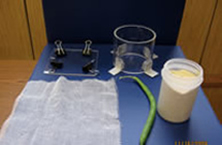
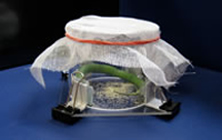
This set up is more difficult, and the assay arena has to be tailored for each natural enemy and the natural enemy must survive for longer periods than normally used. Each lab has had to develop its own assay arena for each natural enemy evaluated. The componenets and fully assembled bioassay arena used for Deraeocoris brevis in Oregon, are shown in fiures 1 and 2.
Complete laboratory bioassays for 2 pesticides for each of the 8 natural enemies.
We have completed the traditional bioassays for more than two materials at each site. The demographic studies have begun at all sites, with most of the G. occidentalis studies being completed (Beers lab). Beers also started on objective 1.2 to provide the other labs with suggestions as to problems and solutions for the field trials.
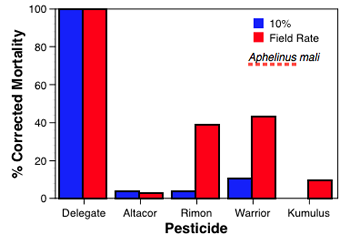
1.1 Laboratory Bioassays.The acute and sublethal toxicity of five insecticides (Cyazypyr, rynaxypyr [Altacor], spinetoram [Delegate], novaluron [Rimon], and lambda cyhalothrin [Warrior II]) and two fungicides (sulfur [Kumulus] and copper hydroxide [Kocide] plus Manzate) were assayed for the two predators Deraeocoris brevis (Hemiptera: Miridae) and Galendromus occidentalis (Acari: Phytoseiidae) and the two parasitoids Aphelinus mali (Hymenoptera, Aphelinidae) and Trioxys pallidus (Hymenoptera, Braconidae). Each pesticide was tested at the full field rate (100%) and at a dilute rate (10%) in comparison with a control treated with water. Acute toxicity over 48 hours was assessed for adult parasitoids and for both larval and adult stage predators. In addition, sublethal bioassays were conducted for the predators to assess the following life history performance characteristics: mortality/ survivorship, longevity, fecundity, egg viability, F1 juvenile survivorship, F1 juvenile development time and F1 sex ratio. The acute and sublethal bioassays were carried out in glass arenas under constant laboratory conditions to provide a worst case evaluation of the potential of each pesticide to disrupt the life cycle performance of the selected natural enemies.
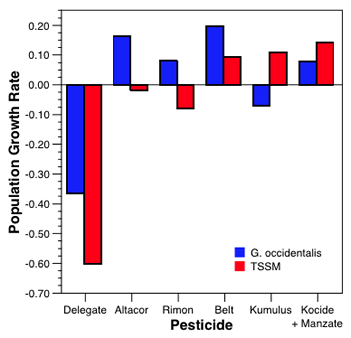
In the case of G. occidentalis it is not possible to assess individual life history performance characteristics and so as an alternative, the population growth rate was monitored in replicated mesocosms at the 10 and 100% field rate for each pesticide.
While the laboratory bioassays are still ongoing, example results provide some initial indications of the disruptive effects of the selected pesticides. While Altacor, Delegate and Rimon had no acute effects on larval G. occidentalis, the two latter materials did prove toxic to adults. Warrior proved to be acutely toxic to both nymphs and adults of D. brevis at both rates tested while Rimon proved to be acutely toxic to nymphs of D. brevis (at both rates). For the two parasitoids the acute mortalities were similar to those found for the predators (see Figs in box below), with Delegate and Warrior being most disruptive, Rimon being intermediate and Altacor and Kumulus having minimal impact. Results from the sublethal bioassays are, in most cases, yet to be completed and analyzed. However, results for G. occidentalis and its twospotted spider mite (TSSM) prey are shown (below) and illustrate the use of the demographic technique.
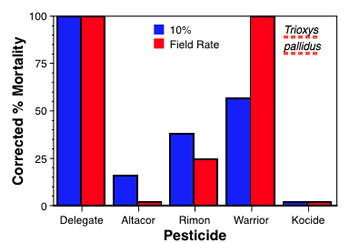
Aphelinus mali (top right/first chart) is the parasitoid of the woolly apple aphid and Trioxys pallidus (middle right/second chart) is the parasitoid of the walnut aphid. Although exposed to completely different pesticide pressures in apple and walnut, they show similarities in response to several of the materials evaluated. Delegate was highly toxic to both parasitoids and Altacor was relatively non-toxic. Rimon affected both parasitoids at the field rate, and Warrior caused ≈ 40% mortality for A. mali, but 100% for T. pallidus.
As more of the assays are completed, we will be able to use data on natural enemy phenology (objective 2) to help determine which materials might be least disruptive at different times of the season.
The mesocosm experiments for G. occidentalis are the furthest along (bottom right/ third chart). We found that Delegate suppressed the growth rate of both G. occidentalis and its twospotted spider mite (TSSM) prey. Altacor did not significantly suppress G. occidentalis, while Rimon appeared to reduce TSSM and allow reasonable G. occidentalis population growth. Belt did not suppress growth rates of G. occidentalis and TSSM. Kumulus reduced growth rates of G. occidentalis and allowed TSSM populations to increase. Kocide + manzate reduced growth rate of G. occidentalis compared to the untreated control while TSSM populations were unaffected.
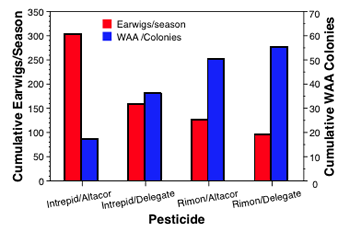
1.2 Large-block replicated field trials. To verify the outcome from the laboratory bioassays under field conditions and to test methods for next year when more of the large plot studies will be performed in all areas, a pilot study was conducted in two Washington apple orchards this year. Two sites (20-25 acres each) were chosen, one with a history of woolly apple aphid and mite problems, and one without. Four treatments were applied, comprised of different combinations of insecticides used for the first generation of codling moth: either Intrepid or Rimon followed by either Altacor or Delegate. Each treatment was replicated four times, with individual replicates of 1-1.5 acres in size. The three application timings were petal fall (100 CMDD [codling moth degree days]), 1st cover (350 CMDD), and 2nd cover (18 d after 1st cover). Pest and natural enemy populations were sampled at 2-3 week intervals from May through October. Results are shown below in the top portion of the box (Field validation).
Our plan is to complete lethal and sublethal bioassays for an additional set of natural enemies including the insect predators Chrysoperla carnea (Neuroptera: Chrysopidae) and Hippodamia convergens (Coleoptera: Coccinellidae), and the spiders Cheiracanthium mildei (Miturgidae) and Misumenops lepidus (Thomisidae). During the 2010 field season, we will also begin replicated field studies of the influence of pesticides that have shown disruptive effects to our natural enemies in the laboratory bioassays in both pear and walnut orchards in addition to apple orchards. The impacts on selected pests and their natural enemies will be monitored.
These laboratory and field assays will allow us to recommend IPM programs that enhance biological control by minimizing disruption of the natural enemy community in orchards. The results of this research will be added to the WSU-DAS and UC-IPM web sites for easy access and will be very useful to apple, pear and walnut growers and pest control advisors. We expect these recommendations to lead to increased biological control in our orchards, which should reduce pesticide inputs leading to higher grower profits and lower worker safety problems.
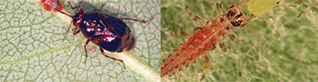
At the Bridgeport orchard, the plots initially treated with Intrepid had consistently lower woolly apple aphid (WAA) densities than those treated with Rimon. The trends within the Intrepid and Rimon plots were similar in that with the second treatment, Altacor treated plots had lower populations than the Delegate treated plots. Overall, it appears that the first spray is most important in “setting the stage” for BC, although the second spray if too disruptive can overcome much of the advantage of having a soft petal fall spray.
The effects of the different pesticides were also evidenced in the inverse relationship of aphid colonies and number of earwigs caught in the different plots. If the pesticides were not suppressing earwig populations, you would expect that the highest earwig numbers would be found in the plots with the highest numbers of WAA colonies, but the opposite trend was seen.
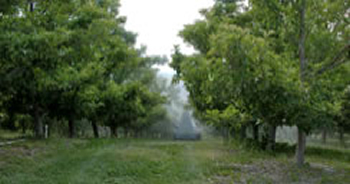
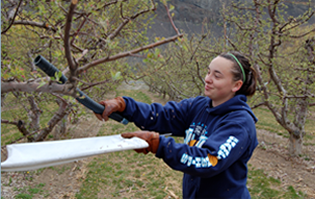
Sampling in tree fruits has long used “beating sheets” (fig. 1) or “limb tapping” to sample natural enemies and pests. The limbs are struck with a rubber hose to dislodge the insects on to the tray below. While this works for some insects, it has a severe limitation: it is an instantaneous sample that only affects the insects on the limb being sampled at that point in time. Insects that occur high on the tree or that move around in response to temperature or light are poorly sampled.
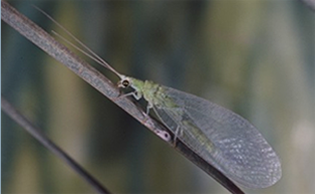
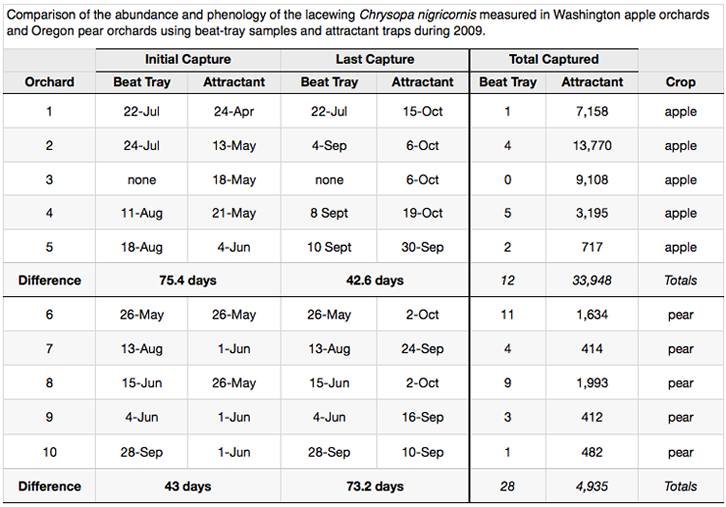
Highly mobile insects such as the green lacewings (fig. 2) are typically under represented in tray counts. Traps on the other hand, accumulate catch over the entire length of the time they are out, so that insects that have a daily movement pattern are represented in the capture if the lure is attractive. The table below shows an extreme example of how poorly beating sheets perform compared to an attractant trap and how that affects our interpretation of natural enemy phenology.
Evaluate phenology in eight apple and three pear orchards; compare attractant traps to traditional methods; start adult phenology studies in walnuts using attractant traps.
All of the milestones for year 1 have been met. Data analysis is in progress and samples should be completely processed before the start of next season.
This past year, we collected beating tray samples from eight apple
orchards in Washington (four in the Quincy area, four near Yakima), and five (instead of
three) pear orchards in Oregon (near Hood River). In all of those orchards plus three walnut
orchards in California, we used an attractant discovered in our 2008 studies to capture the
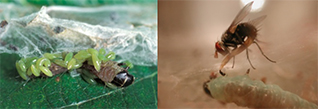
green lacewing Chrysopa nigricornis (section above, bottom photo). We are still
processing the beating tray samples, but in general, we can say that the number and
diversity of natural enemies collected is a tiny fraction of what we found in our attractant
traps (objective 3).
The lure for C. nigricornis performed well at nearly all sites (Table on next page). In all situations, the lure caught lacewings earlier and later, and in dramatically higher numbers than what we captured in beating trays (Table at bottom of report section). Although beating trays may have their place for estimating populations of certain natural enemies, it is clear that they can distort the impression of natural enemy importance and phenology. Using beating trays alone, C. nigricornis would be considered a rare natural enemy; whereas the truth is that it is very common.
In both Washington and California, we had one orchard each that
had a very low trap capture. The Washington orchard was a very small orchard that may have
contributed to the low catch. At multiple sites over the past two years in Washington using
the lacewing attractant, we have not seen such low captures. In the three commercial apple
orchards near Quincy, this year we captured 30,036 (7,158; 13,770; and 9,108) C.
nigricornis. In California and Oregon the trap catches were lower, but still
substantial (3,113 in two orchards in California and 4,935 in five Oregon orchards). The
differences in trap catch between apple, pear, and walnut suggest that we might need high
and low sensitivity lures for different situations. The high trap catch in Washington is
clearly excessive for determining population trends and using the lure to evaluate impacts
of pesticides on C. nigricornis. Lure longevity and dose of the C.
nigricornis attractant is examined further in Objective 3.
The phenology of C. nigricornis is still being
investigated, but it is clear that it emerges fairly late in the season in Washington apples
(mid-May) and about a month earlier in California. Unfortunately, we have not found any
studies of the temperature-development of C. nigricornis in the laboratory, but a
survey of nine different studies of lacewings showed that the lower threshold for
development varies from 45-50°F. A preliminary model (section below) shows great promise
that we will be able to change management programs to preserve this important predator.
In addition to the orchard samples, Horton sampled orchards with bands from four orchards in the Yakima area and Jones collected from eight sites from Brewster WA to Frenchman Hills. The emergence data has all been collected, but only Horton’s has identified all specimens and entered the data into the computer for analysis; Jones’ data are still being processed. For this coming year, band data will be available for four apple orchards near Yakima, nine apple orchards from Brewster to Quincy, and five pear orchards near Hood River, OR.
The beating tray data will be taken from the same orchards in Washington and Oregon and emergence data from overwintering will be available from 13 orchards in Washington and the 5 pear orchards in Hood River. We will also expand the number of lures being evaluated for season-long phenology of natural enemies based on data collected this year in objective 3. This winter, modeling studies on C. nigricornis will continue with validation being performed using data collected next year. Shearer and Jones have submitted two grants leveraging SCRI funds to begin surveying natural enemies in sweet cherry orchards (three orchards in Washington and three in Oregon) that will be included in model development and validation.
The lacewing attractant shows how sampling using only beating trays distorts the perception of natural enemy importance and timing. We expect that our attractant studies in conjunction with overwintering band emergence studies, will provide us with a much better understanding of the importance, diversity and phenology of our key natural enemies. When the data are complete, it will allow us to time pesticide applications for the pests so that impacts on natural enemies are minimized. When combined with data on sublethal effects on natural enemies (from objective 1), we should have a much better understanding of ways to enhance BC in our orchard systems.
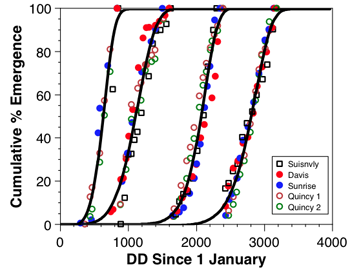
A preliminary model from two California walnuts orchards (Mills data) and three Washington apple orchards (Jones’ data only) shows that phenology of C. nigricornis among sites is very similar on a degree-day basis (graph 1). As additional data from the Horton and Shearer labs are compiled, we will continue the efforts to develop a robust phenology model for this key natural enemy, as well as others.
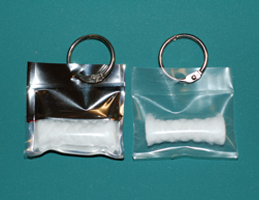
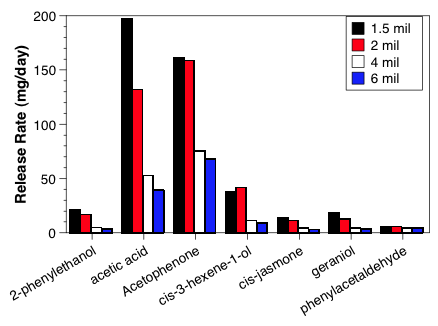
Building a practical lure means that we need to have the release rate nearly constant as temperature changes and a release rate that optimizes trap capture. Each chemical tested has a different release profile (chart 1) that needs to be assessed and then checked for optimum biological activity (chart 2) for C. nigricornis lure.
We used polyethylene tubing of different thicknesses and if needed, made the packet out of foil with polyethylene windows of various sizes (fig. 1).
3.3. Evaluate traps for monitoring diversity, abundance, and phenology of natural enemies, and demonstrate the utility of lures for assessing the effects of spray programs on natural enemy abundance in orchards.
All of the milestones for year 1 have been met and exceeded. Data analysis is still ongoing for Oregon and some of the Washington samples taken around Yakima. That data analysis should be completed before the start of next season.
3.1 Lure Release Rates. We completed
our studies on the longevity and release rates for 14 different attractants this year.
We generally were able to evaluate release rate and longevity with four different types
of lures (typically heat sealed polyethylene tubing of different thicknesses with a
cotton dental wick upon which the attractant is applied -see above) during the spring,
summer, and fall. The polyethylene tubing was generally acceptable as a release device
(top figure above); our studies showed that release rate for each chemical is a function
of tubing thickness and temperature. The temperature effects only appeared to be
significant between cooler periods (spring or fall) and the summer; in no cases did we
have non-linear release of attractants within a test (generally 1 month periods) related
to temperature. Studies with other dispensers (such as mating disruption dispensers)
have already shown that release rate is a function of temperature accumulations and we
will be performing that analysis this coming winter.
Although the tubing worked well for the majority of attractants tested, for six compounds we needed to develop various modifications of the dispensers because the lure longevity was too short. In four of those cases, we were able to increase the volume of the attractant that was applied to the wick and obtain the desired longevity. However, for at least two of the compounds, we needed to develop a foil based lure with different size polyethylene windows to regulate the release rates. In all cases, we were able to develop lures that would last >28 days during the summer at levels that were biologically active.
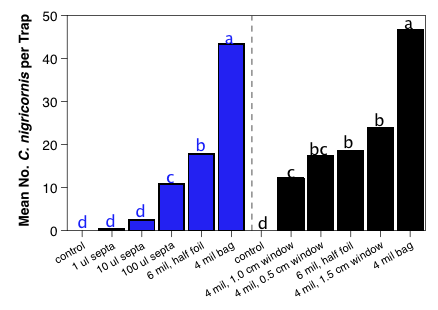
In addition to testing the lure release rates, we also performed field bioassays for a number of different types of lures to evaluate the sensitivity of the insects to release rate. In 2008, we had performed this in one orchard with four rates of seven different lures. In that test, the natural enemy diversity was relatively restricted, but there were no real trends in trap catch that could be related to lure release rates. This past year, we ran three experiments where lure rate was evaluated. The first was to restrict the release rates of our C. nigricornis lure, which catches too many lacewings (see objective 2). In that test, we evaluated a normal 4 mil thick bag, a 6 mil half foil bag, and used gray rubber septa loaded with 1, 10 or 100 µl (box below, lower figure, blue bars). We found that the reduced release rate did significantly reduce the capture of C. nigricornis, with the 6 mil half foil bag lures catching roughly 40% of the normal lure and the 100 µl septa catching ≈ 25% of the normal lure (box below, lower figure, blue bars). We ran a follow-up trial because the 100 µl septa load took roughly 7 days to absorb into the septa, making it impractical for any normal situation. In the second trial, we evaluated the different size windows, which allowed us to adjust the release rate enough to bring the trap catch down to a reasonable level (box below, lower figure, black bars). The final release rate trial evaluated trap catch for our four new candidate lures, but to date we have only processed traps from the first sample date.
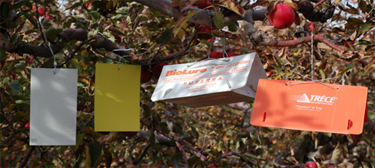
The effect of trap type was evaluated with a combination of
three lures and an untreated check. We evaluated the standard white delta trap, an
orange delta trap, a white sticky card, and a yellow sticky card (fig. 2). We chose
lures to evaluate that had shown a broad spectrum of activity so that we could evaluate
trap type for a number of taxa. The lures used were: (1) geraniol + 2-phenylethanol, (2)
2-phenylethanol + methyl salicylate, and (3) acetophenone. We present data for a trap
type using only the most active lures for a given taxa.
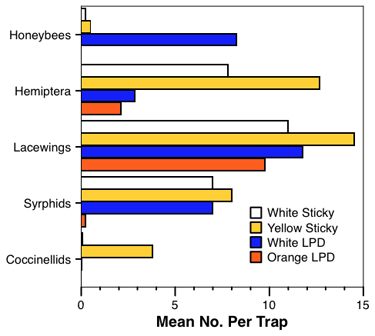
The yellow card was consistently one of the most sensitive for all the natural enemies, edging out all the other traps types for all natural enemies (chart 3). The effects were most marked for the parasitic hymenoptera (data not shown because we caught >360 per trap on the yellow cards), but the trends were mostly consistent for the other taxa as well. The honeybees did not respond to orange delta traps, white sticky traps, or yellow sticky traps, allowing us to use any of those trap types to minimize undesirable honeybee captures.
3.3 Evaluating Lure Attractiveness. This sub-objective had four different experiments run this year (1) long-term testing at eight apple sites in Washington (four in the Wenatchee area, four in Yakima), five pear sites in Oregon near Hood River, and three walnut orchards in California; (2) an in-depth study of the interactive effects of three particularly attractive compounds (geraniol, methyl salicylate and 2-phenylethanol); (3) the investigation of new materials for next years studies, and (4) measuring insecticide impacts using our attractant lures.
This past year, we examined ten lure blends as potential tools for monitoring natural enemy diversity, abundance and phenology. We looked at 1) differences in attractiveness among blends of seven different attractant compounds, 2) arthropod diversity and the attraction of particular taxonomic groups to certain lure types, and 3) phenological trends in the four most abundant insect groups.
At four commercially managed apple orchards (WSU Sunrise and 3
orchards in the Quincy area of WA), we deployed a total of 160 traps (40 traps/orchard ×
4 orchards) from late May to early October, all of which were checked and serviced
weekly.
Similar trapping protocols were employed in the orchards sampled in Oregon and California. In this report, we will be presenting data and analyses from the north-central WA apple orchards (Jones lab) and California walnut orchards (Mills lab); data from the other sites has not yet been completely processed. For simplicity, analyses of trap-catch data are confined to traps using the top three most attractive lure blends. In evaluating the numbers caught, it is important to understand that if a particular group is found only during a portion of the test period, the overall mean is decreased dramatically, even though large numbers may have been caught during certain periods of the season.
The lures attract a broad diversity of natural enemies and in some cases, herbivorous taxa (e.g., moths, western flower thrips). In general, our lures bring in large numbers of lacewings and parasitic Hymenoptera, with other groups also well represented in some of our blends. Our lures can be used to develop a better understanding of the phenology of target natural enemy groups (box below, lower figure). However, they also demonstrate that the reliance in the past on primarily one method of sampling (the beating trays) has grossly underestimated numbers and distorted our understanding of natural enemy phenology. For example, we found that beat tray sampling suggested that parasitoid densities spiked early and then late in the season, while our attractant-trapping indicated that these tiny wasps remain abundant throughout the growing season. Designing management plans without a true picture of the phenology of these organisms cannot be successful.
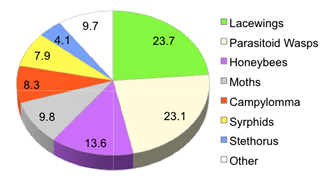
The majority of specimens captured in north-central WA apples were green lacewings (~24%) and parasitic Hymenoptera (~23%) (chart 4). While the percentages represented by other taxonomic groups were much lower, there were actually thousands of individuals trapped in all groups except the Stethorus beetles.
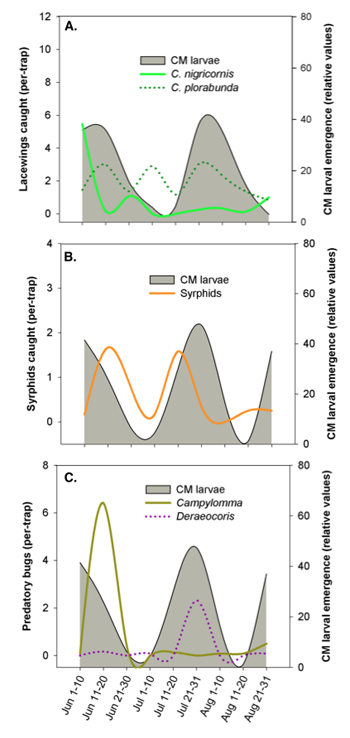
In WA apples, using the top three most attractive lures, we
were able to track the phenology of lacewings, syrphids, parasitoids, and predatory
Hemiptera (chart 5). From our trapping data, the phenologies of these groups appear to
be quite variable. Among the lacewings, we found that Chrysoperla plorabunda
exhibited a different seasonal pattern than C. nigricornis (chart 5, A). At
this site in Quincy, WA, the initial C. nigricornis flight peaked in late-May/
early-June and then dropped off markedly by late June. However, C. plorabunda
counts were clearly rising as C. nigricornis started dropping off. C.
plorabunda then exhibited two more peaks, one in early July and another in late
July.
Syrphid phenology suggested there may be two “pulses” in adult
activity—the first in mid-June and the second in mid-July (chart 5, B). Syrphids are
important predators of common apple aphids, as well as woolly apple aphids, which
contributes substantially to the suppression of these secondary pests.
Predatory bugs, such as Campylomma and Deraeocoris, are important predators of codling moth eggs and other soft-bodied prey. Campylomma numbers spiked in late June, followed by a pulse in Deraeocoris numbers from mid- to late July (chart 5, C). Importantly, the spike in Deraeocoris populations was almost perfectly aligned with the second CM generation. In order to preserve the benefits provided by Deraeocoris (e.g., suppression of codling moth, obliquebanded leafroller (OBLR), and the multitude of secondary pests), management strategies might consider concentrating codling moth and/or OBLR sprays during their early-season generations.
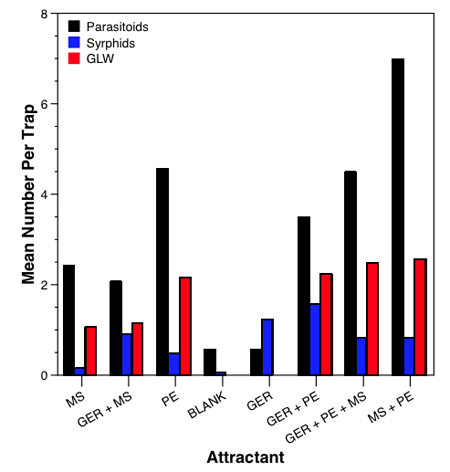
Our long-term trapping data in NC WA showed the blend of
geraniol, 2-phenylethanol (PE), and methyl salicylate (MS) consistently captured more
lacewings (five species), syrphids (12 species), and parasitoids (19 different families)
than any other blend. The question was which components were the different taxa
responding to?
A factorial experiment allowed us to look at all possible combinations of attractants. Green lacewings responded to any lure with PE, syrphids responded to geraniol containing lures, and parasitoids responded best to lures containing PE and to a lesser extent MS (chart 6).
Large numbers of certain parasitoid families
(Scelionidae, Eulophidae, Pteromalidae, Eucoilidae, and Trichogrammatidae) were caught with
phenyl-acetaldehyde (PAA) lures. The compound cis-jasmonate (CJ) was attractive to two
taxonomic groups: syrphids and Campylomma (predatory bugs).
Acetophenone (AP), consistently caught a particular large Ichneumonid wasp. Ichneumonids are known to be important enemies of obliquebanded leafroller (OBLR) and codling moth (CM), suggesting that we may have serendipitously discovered an effective lure for this wasp species. AP was also very attractive to western flower thrips. AP is very promising: in an experiment conducted earlier in the season, a blend of AP, PE, and acetic acid was tested against our “best blend” (GER +PE+MS), and the AP blend caught as many lacewings, syrphids, and parasitic wasps as the GER blend.
Promising compounds, such as PAA, AP, and CJ, will be incorporated into the general pool of attractants to be tested in the 2010 growing season. These new compounds will also be integrated into investigations of trap type and dose response effects.
In the absence of an easy monitoring tool only pest activity is currently monitored in western orchards. These data will be used to develop an effective monitoring tool for a range of key natural enemies in western orchards for use by growers and pest control advisers (PCAs). A natural enemy monitoring trap will allow growers and PCAs to track changes in natural enemy activity that might be caused by use of disruptive pesticides or unusual climatic conditions. We expect natural enemy traps to become a valuable tool to verify the activity of natural enemies and to enhance recognition of the importance of biological control in our orchards (see box below). In turn, this should reduce pesticide inputs leading to higher grower profits and lower worker safety problems.
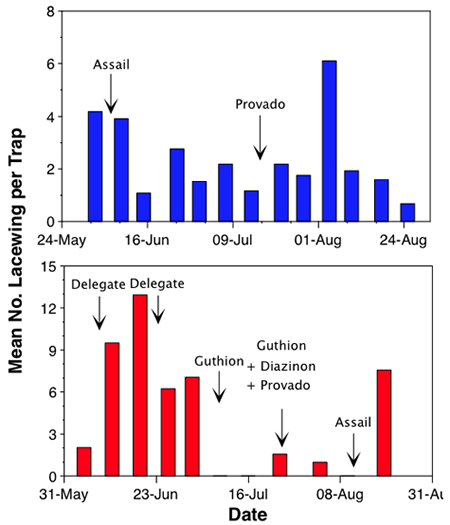
Our attractant trapping has made it possible to assess more efficiently and accurately the effects of insecticide applications on natural enemies. In one orchard near Quincy, we found that lacewing populations experienced oscillations but never “crashed” (chart7, top). This orchard had relatively few sprays applied, and none were organophosphates. Conversely, a different orchard in the same area saw its lacewing population decline sharply and remain low for approximately four weeks, during which two applications of azinphosmethyl (Guthion) were applied (chart 7, bottom). During this same time period at other Quincy orchards, our trapping indicated that lacewing populations tended to rise. These findings provide evidence for the common contention that certain insecticides interfere with natural enemy abundance and/or activity.
Complete video monitoring in 2 apple and 1 pear orchards, and complete development of CM antibody, begin generalized collection of natural enemies for later gut content analysis from apple, pear, and walnut.
The video monitoring was problematic and did not give data that was useful in supplementing the molecular gut content analysis. Pitfall trap collections were made from apple and pear orchards, but not from walnut. The LAMP (loop-mediated DNA amplification) procedure was validated and will be used to screen specimens for presence of codling moth.
4.1 Videos We evaluated the usefulness
of video recording of sentinel codling moth larvae cocoons in one pear and one apple orchard
at the USDA-ARS Moxee Farm (see box above). Two video recorders each with 4 cameras were
tested for 3 months.
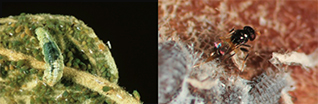
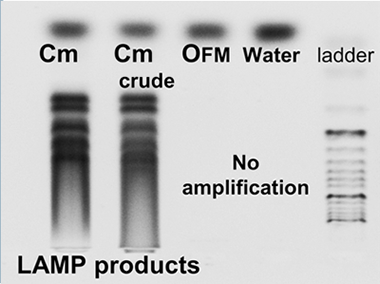
Molecular Methods. A new DNA amplification method was developed and optimized to detect codling moth DNA in the guts of predators. Predators were collected by pitfall trapping at orchards in Yakima and Wenatchee WA and Hood River OR from July through September. We developed loop-mediated DNA amplification, LAMP, to detect DNA remains of codling moth (Cydia pomonella) in whole-body homogenates of arthropod predators. Six LAMP primers totaling 157 bp were designed within the 226 bp region of an odorant receptor gene of C. pomonella. LAMP specificity was challenged with DNA from 17 non-target arthropods including closely related Lepidoptera, and proved to be specific to codling moth (figure below). We used the LAMP procedure to demonstrate detection of C. pomonella DNA up to 96 hrs post-ingestion in the crab spider, Misumenops lepidus. We have begun processing the pitfall trap data and expect to finish this winter.
We will continue sampling with pitfall traps and will also use beat trays to collect predators for gut content analysis. Video cameras will be used in the lab to observe ground predator behavior with cocooned versus active larvae to determine if their behavioral repertoire supports attack of the cocooned larval stage. Predators collected in pitfall traps will be analyzed for codling moth in gut contents.
The gut content analysis will be used to help clarify which natural enemies are important for our conservation efforts as well as providing targets for our monitoring efforts.
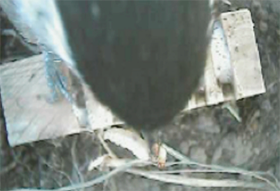
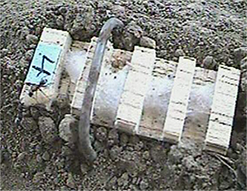
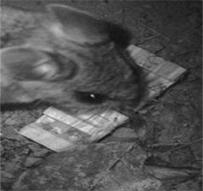
The video cameras proved unreliable in the field for both technical and biological reasons. To conserve recorder memory, we used motion detection to start recording, but blowing leaves and light shadows caused by moving leaves in the tree canopy triggered recording reducing efficiency. Bird and rodent predators were responsible for virtually all predation events observed (all but 2 examples of ant predation) (3 figures below). We are uncertain if the lack of observed insect predators was a result of the artificial observation arenas and set up or truly reflects normal situations in those orchards. We did attempt to use a cover to reduce bird predation and a screen fence to reduce rodents. The cover eliminated birds, but the screen fence (1 meter high) did not prevent rodents (Peromyscus spp.) from entering the arena.
PCR based detection of DNA in predator gut contents has been worked out, but requires too much purification before processing the sample. This makes them difficult and costly. We developed a new molecular method (LAMP or loop-mediated DNA amplification) that is much cheaper, quicker, and allows use of whole body homogenates of the predator.
Typical economic studies on the use of biological control focus solely on the number of pesticides reduced or the value of the commodity saved. However, costs associated with just reduced numbers of sprays ignore environmental impacts, worker safety, and markets opened by eliminating pesticide residues.
Develop a model to define cost structures of alternative pest treatments to be conducted in the field trials of Objective 1; gather data to obtain preliminary cost structures. Conduct a survey to elicit farmers’ willingness to pay for IPM indirect benefits.
Most of year 1 has been spent developing the basic economic models that will be paired with pest control risk/cost scenarios that will be the basis for determining the costs associated with conventional and enhanced BC programs.
While results from objective 1 have yet to provide a complete picture of the impacts of different pesticides on natural enemies, the results so far show differences that will help us choose IPM scenarios that would be expected to disrupt or conserve biological control in orchard systems. The development of an economic model for apple is in process and will be available for testing the nine different IPM scenarios in the spring of 2010. The nine scenarios assume different CM densities (risk of crop injury), and a response using control options composed of different combinations of pesticides. These scenarios represent a spectrum of programs that are expected to have varying degrees of impact on biological control in apple orchards. Economic data for the nine scenarios have been gathered and will serve as inputs for the economic model. The economic model will provide a basis for evaluating the relative impacts of different IPM programs on biological control once data from objective 1 are provided in year 2.
The lure for C. nigricornis performed well at nearly all sites
(Table on next page). In all situations, the lure caught lacewings earlier and later, and in
dramatically higher numbers than what we captured in beating trays (Table on next page).
Although beating trays may have their place for estimating populations of certain natural
enemies, it is clear that they can distort the impression of natural enemy importance and
phenology. Using beating trays alone, C. nigricornis would be considered a rare natural
enemy; whereas the truth is that it is very common.
The economic benefit of different IPM scenarios will not come just from enhanced biological control, but can occur from the more efficient use of farm labor due to the safety of certain pesticides that result in shorter re-entry periods. The value of the economic model is that results can be generated over more than one growing season and therefore capture the accumulated benefits of IPM programs that might not show an economic benefit if results from only a single year are examined. A literature review of past studies has been conducted to formulate a model to include growers’ willingness to pay for IPM indirect benefits. Most studies used contingent valuation (CV) to elicit grower’s willingness to pay for decreased environmental damage by implementing novel technology. We focused on studies dealing with non-point source water pollution abatements. The fact that adoption of IPM programs relying on biological control is a sequential task rather a one-time task, will make it difficult to assess a one-time value for decreased water contamination, as it usually is the CV approach. Thus, we decided to not use the willingness to pay format to elicit the value for indirect benefits of IPM programs. We will be obtaining these parameters from previous related studies and/or may opt a new assessment tool (Specialty Crops (SISC) Pesticide Metric) that is currently being developed.
A survey is being developed under objective 6 that is coordinated with this objective. The initial survey will be conducted in the walnut industry in CA. This survey will include questions that will help us to understand the likelihood of adopting biological control in orchard systems and will serve as a model for surveys to be conducted in pome fruit in subsequent years of this project. The walnut survey will be conducted in the winter of 2009-10 and results will be available in the spring of 2010.
Plans for year 2 are to apply the economic model to apple walnut and pear IPM scenarios using data generated from surveys and objective 1.
The kinds of data generated from economic analysis will inform growers and consultants of the trade-offs of using different IPM strategies that act to conserve biological control in orchards. The outcomes can be used to design education programs that links to the negative impacts of new insecticides on natural enemies based on objective 1.
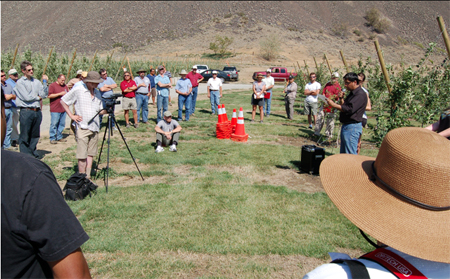
Although we had planned no milestones for this objective in year 1, we have been active discussing preliminary research findings and giving growers information on ways to enhance biological control. We have given multiple presentations at field days, developed web pages, handouts, and articles in grower publications.
This part of the grant was initially intended to start in year 2 and run through the end of the grant. However, we strongly felt the need to move on this area and have made significant progress in parts of the future year’s milestones.
Year 1 was not considered to be the start of this section of the project. However, we have designed surveys that will be used for walnut growers, then adapted to apple and pear growers. We have also started giving presentations, preparing papers, and have set up a project web site that details progress and provides general information to interested stakeholders. Progress reports will also be posted on the site.
6.1. Survey A survey of walnut
growers in California using the Tailored Design Method is in the final stages of
preparation. The project personnel will work with the WSU Social and Economic Sciences
Research Center (SESRC) to implement the California walnut grower survey in
January-March 2010. During spring/summer 2010, a preliminary analysis of survey results
will be conducted and reports prepared. Results from the walnut survey will inform the
structure of future surveys of pear growers in Oregon (Winter 2010/11) and apple growers
in Washington (Winter 2011/12).
The walnut survey includes questions about pest management
practices, sources growers access for information, knowledge of biological control,
constraints to the adoption of biological control, research and outreach needs, farm
characteristics, and grower demographics. Using the survey data, we will build
multivariate/econometric models to measure the effects of various factors on the
likelihood of adopting biological control. The first step in the survey process (i.e.,
working with colleagues to draft the California walnut grower survey and obtaining the
names and addresses of growers to compile a mailing list for the top walnut-producing
counties), is in its final stages.
The walnut survey data will help us better understand farmers' pest management decision-making helping to ensure the effectiveness and speed of the transfer of biological control (and related IPM) knowledge and technology to growers. Additionally, survey results will inform future biological control research, education, and outreach activities.
6.2. New IPM Programs The work in
this area is targeted for years 3-5 of the project. We will discuss and begin to
organize data from the project this winter. This will help with coordination of data
collection and reporting so that synthesis and incorporation flows as a natural product
of the project.
6.3. Education Program A web site was established (enhancedbc.tfrec.wsu.edu) as a primary means of posting information about the project. It has been very useful as a place to refer interested individuals desiring to learn more about the project and will serve as a primary location for posting research results and reports generated by the project. The web site will also eventually serve as a location for educational materials developed by project.
The project’s Advisory Committee will be used over the next 1-2 years to provide input in developing a comprehensive educational program for the project. The educational program will be informed from grower survey results
The primary impact of the project in year 1 has been to raise an understanding of the value of biological control in orchard systems and to explain the projects expected contributions to enhancing biological control in orchards. The survey or walnut growers will provide a framework for future surveys in other crops and help to shape education and outreach efforts in the next four years.
enhancedbc.tfrec.wsu.edu or enhancedbiocontrol.org (entry to portal)
Jones VP and S Steffan. Common natural enemies in Washington tree fruits.

USDA-NIFRA SCRI grant #2008-04854