
Biological control is a complex, knowledge-intensive practice that requires growers and pest management consultants to learn natural enemy and pest life cycles, toxicity and effectiveness of insecticides at different life cycle stages, strategies for managing insecticide resistance, and maintenance of long-term ecological balance while controlling pests and maximizing production. As part of a large USDA Specialty Crop Research Initiative (SCRI) project, researchers at Washington State University, University of California-Berkeley, and Oregon State University are seeking to better understand apple, pear, and walnut growers’ experiences and perspectives related to pest management, in general, and biological control, in particular. This report presents results from a 2010 survey of California walnut growers. Survey results will inform future educational and outreach efforts.
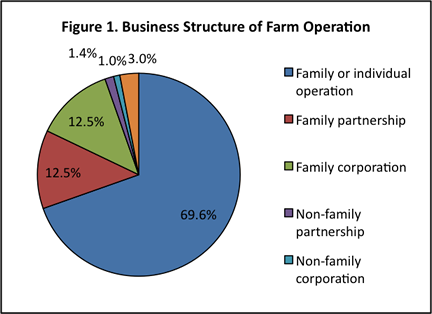
The majority of survey respondents (87%) were orchard owners, partners, or lessees, while 9% were hired managers. Approximately 70% of respondents described their farm operations as family or individual operations (see Figure 1).
Respondents operated, on average, 385 acres of farm/ranch land in 2009. Over one half (54%) of respondents produced other agricultural products (e.g., almonds, cherries, grapes, peaches, prunes) in addition to walnuts.
Respondents grew, on average, 110 acres of bearing walnuts and 21 acres of non-bearing walnuts in 2009. The most popular walnut varieties (in terms of mean bearing acres) were Chandler (45 acres), Hartley (15 acres), Howard (14 acres), Tulare (8 acres), and Serr (8 acres).
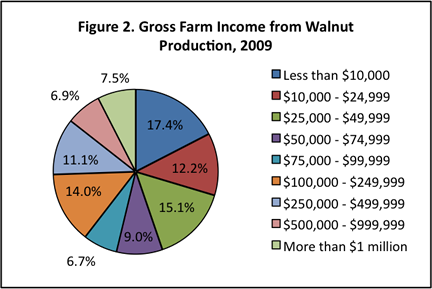
Seventeen percent of respondents had less than $10,000 in gross income from walnut production, while 14% reported $500,000 or more in gross walnut income (see Figure 2).
When making pest management decisions for their walnut orchards, survey respondents consider economic cost, environmental impacts, and human health impacts, among other factors. Approximately 75% of respondents believe economic cost and health impacts are “very important” in pest management decision-making, while 60% believe environmental impacts are “very important” (see Table 1).
| Not Important (%) | Somewhat Important (%) | Very Important (%) | |
|---|---|---|---|
| Economic Cost | 2.2 | 22.2 | 75.6 |
| Human Health Impacts | 3.5 | 21.7 | 74.8 |
| Environmental Impacts | 2.9 | 36.9 | 60.3 |
The most important sources of information for making pest management decisions for walnut orchards were Pest Control Advisors (PCAs) affiliated with chemical companies, insecticide label information, formal education and continuing education classes, University of California Cooperative Extension (UCCE) publications, and UCCE advisors. The least important sources of information for making pest management decisions were crop consultants, marketing organizations, field workers, pesticide applicators, commodity associations, family members, and immediate neighbors.
Survey respondents reported varying levels of contact with UCCE with regard to their walnut orchards. The most frequent forms of contact were reading UCCE bulletins and visiting UCCE websites. On-farm visits by UCCE advisors, research collaborations with UCCE advisors, and visits to UCCE offices were less common (see Table 2).
| Not At All (%) | Once (%) | Twice (%) | Three Times or More (%) | |
|---|---|---|---|---|
| Read bulletin or report | 23.9 | 10.8 | 17.2 | 48.1 |
| Visited website | 55.5 | 12.2 | 11.6 | 20.8 |
| Attended meeting, workshop or field day | 37.2 | 25.8 | 22.2 | 14.8 |
| Visited office | 61.1 | 16.9 | 11.0 | 11.0 |
| Research collaboration | 81.6 | 8.9 | 3.2 | 6.3 |
| On-farm visit | 75.2 | 14.0 | 5.5 | 5.3 |
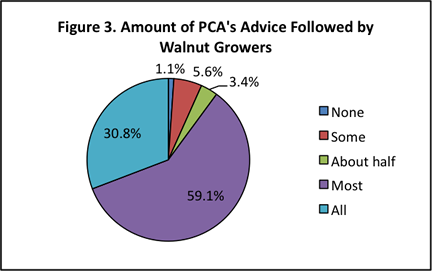
Most survey respondents (90%) used the services of a PCA. Of those respondents, 17% consulted with their PCA more than once a week, 33% once a week, 25% every 2–3 weeks, and 26% once a month or less. Most respondents (90%) followed either most or all of their PCA’s advice (see Figure 3).
Respondents were asked about changes in their use of selected pest management practices during 2007–2009 (see Table 3). Nearly 30% of respondents decreased their use of insecticides more harmful to non-target species. Over 25% of respondents increased their use of insecticides less harmful to non-target species; 20% increased their use of monitoring for insect pests; 14% increased their use of pheromone or sticky trips; 11% increased their use of monitoring for natural enemies; and 8% increased their use of biological control practices.
| Decreased (%) | Same (%) | Increased (%) | Did Not Use (%) | Don't Know (%) | |
|---|---|---|---|---|---|
| Insecticides less harmful to non-target species | 4.6 | 38.0 | 35.2 | 13.8 | 18.4 |
| Monitoring from insect pests | 1.8 | 65.4 | 19.9 | 7.4 | 5.4 |
| Pheromone or sticky traps | 1.8 | 57.5 | 13.9 | 21.0 | 5.8 |
| Monitoring for natural enemies | 0.6 | 53.5 | 10.5 | 24.0 | 11.3 |
| Biological control practices | 0.8 | 28.5 | 7.7 | 48.7 | 14.3 |
| Pheromone mating disruption | 0.8 | 22.8 | 7.1 | 58.1 | 11.2 |
| Degree day calculations | 0.2 | 49.9 | 6.6 | 29.1 | 14.2 |
| Insecticides more harmful to non-target species | 29.7 | 32.7 | 1.0 | 19.4 | 17.2 |
Most survey respondents (93%) reported that they, their employees, PCAs, and/or other individuals monitored their walnut orchards for insects in 2009. For those respondents, 77% relied on PCAs, 49% relied on themselves, 7% relied on employees, and 4% relied on other individuals for insect monitoring. On average, 9.5 hours per month were spent monitoring for insect pests and 6.1 hours per month were spent of monitoring for natural enemies and beneficial insects.
Over half (54%) of survey respondents relied on one or more biological control practices to control for insect pests in their walnut orchards in 2009. Of those respondents, 87% minimized factors that harm natural enemies, 39% enhanced natural enemy habitats, and 6% released commercially produced natural enemies. Respondents, on average, had been using “conservation biological control” (i.e., minimizing factors that harm natural enemies and enhancing natural enemy habitats) for 10 years and “augmentative biological control” (i.e., releasing commercially produced natural enemies) for 7 years.
Survey respondents who relied on biological control practices to control for insect pests in their walnut orchards perceived many benefits of biological control. The primary perceived benefits were reduced input costs, environmental protection, reduced harm to beneficial insects, less reliance on harsh chemicals, and worker safety.
Survey respondents who did not rely on biological control practices to control for insect pests in their walnut orchards provided many different reasons for their non-adoption of biological control. The primary reasons for non-adoption were lack of knowledge, minimal pest pressure, not recommended by PCA, high cost, and small acreage.
Survey respondents were asked about their experiences with three primary walnut pests: codling moth, walnut husk fly, and navel orangeworm. These pests exerted varying degrees of pressure in 2009 (see Table 4).
| No Pressure (%) | Low Pressure (%) | Medium Pressure (%) | High Pressure (%) | Don't Know (%) | |
|---|---|---|---|---|---|
| Codling moth | 11.9 | 46.2 | 24.9 | 4.1 | 12.9 |
| Walnut husk fly | 22.1 | 29.1 | 28.1 | 9.4 | 11.2 |
| Navel Orangeworm | 42.0 | 30.2 | 5.6 | 1.0 | 21.2 |
Respondents were asked to indicate the degree to which they select insecticides and time insecticide applications (for control of primary walnut pests) so they are least disruptive to the natural enemies of secondary pests. They were also asked to indicate the degree to which they use spot sprays to minimize harm to the natural enemies of secondary pests. Results are reported in Table 5.
| Never (%) | Sometimes (%) | Always (%) | Don't Know (%) | |
|---|---|---|---|---|
| Codling Moth | ||||
Select insecticides so they are least disruptive to NEs * |
7.7 | 37.0 | 30.8 | 24.5 |
Time insecticide applications so they are least disruptive to NEs |
16.2 | 34.9 | 19.7 | 29.2 |
Use spot sprays to minimize harm to NEs |
61.1 | 21.4 | 3.3 | 14.1 |
| Walnut Husk Fly | ||||
Select insecticides so they are least disruptive to NEs * |
16.0 | 34.0 | 22.3 | 27.7 |
Time insecticide applications so they are least disruptive to NEs |
23.0 | 28.9 | 17.1 | 31.0 |
Use spot sprays to minimize harm to NEs |
43.5 | 28.2 | 10.5 | 17.9 |
| Navel Orangeworm | ||||
Select insecticides so they are least disruptive to NEs * |
25.3 | 26.0 | 15.9 | 32.7 |
Time insecticide applications so they are least disruptive to NEs |
28.8 | 22.6 | 13.5 | 35.1 |
Use spot sprays to minimize harm to NEs |
58.8 | 14.6 | 4.3 | 22.3 |
| * NEs = natural enemies of secondary pests | ||||
Respondents were asked about their use of degree-day calculations to predict codling moth generations, monitor infestation levels, and properly time sprays for different generations. Nearly half (48%) of respondents reported always using degree-day calculations, while 17% reported occasional use and 15% reported no use of degree-day calculations. Nearly 20% of respondents did not know if degree-day calculations were used in their walnut orchards.
Thirteen percent of respondents used pheromone mating disruption to control for codling moth in their walnut orchards in 2009. Of those respondents, 40% used sprayable formulations (e.g., Checkmate CM-F), 35% used aerosol puffers (e.g., Puffer CM-O), and 24% used hand-applied dispensers (e.g., Isomate C Plus).
Survey respondents were asked if certain secondary walnut pests required treatment in their walnut orchards in 2009. The following pests required treatment by the reported percentages of respondents: twospotted and Pacific mite (43%), European red mite (16%), walnut aphid (9%), scales (7%), redhumped caterpillar (4%), leafroller (3%), green fruitworm (1%), and dusky-veined aphid (1%). Forty-four percent of respondents reported that no secondary pests required treatment; 11% did not know if secondary pests required treatment.
Respondents were also asked about changes in secondary pest problems in their walnut orchards during 2007–2009. Most respondents did not face increased secondary pest problems (see Table 6).
| Decreased (%) | Same (%) | Increased (%) | Not a Problem (%) | Don't Know (%) | |
|---|---|---|---|---|---|
| Walnut aphid | 11.3 | 23.3 | 1.7 | 39.4 | 24.2 |
| Dusky-veined aphid | 9.1 | 16.6 | 0.9 | 45.0 | 28.4 |
| Scales | 8.8 | 19.4 | 7.0 | 38.3 | 26.4 |
| Twospotted or Pacific mite | 7.0 | 39.2 | 5.5 | 26.4 | 21.7 |
| European red mite | 6.2 | 30.2 | 3.1 | 34.6 | 26.0 |
| Redhumped caterpillar | 13.3 | 18.5 | 1.3 | 41.7 | 25.2 |
| Green fruitworm | 5.4 | 12.1 | 0.7 | 47.3 | 34.6 |
| Leafroller | 5.3 | 12.6 | 1.8 | 46.4 | 34.0 |
| Tussock moth | 4.5 | 10.2 | 0.0 | 47.0 | 38.3 |
This research is supported by grant #2008-04854 from USDA-NIFA Specialty Crop Research Initiative (SCRI) program. Matching funds were also provided by Washington State University, Oregon State University, University of California-Berkeley and the Washington State Tree Fruit Research Commission.

USDA-NIFRA SCRI grant #2008-04854